


Imagine a future where every customer interaction feels uniquely tailored, driven by AI that anticipates their needs before they even articulate them – personalized product recommendations popping up just when you’re considering a purchase, or customized learning paths adapting to your individual progress. This level of personalization hinges on powerful generative AI models, and increasingly, businesses are leveraging Amazon Bedrock to access and deploy these sophisticated tools.
As organizations scale their use of Bedrock for batch inference – processing large volumes of data to power these personalized experiences – the complexity increases exponentially. Ensuring consistent performance, accuracy, and cost-efficiency across these operations becomes paramount, moving beyond simple ‘it works’ to a proactive approach that anticipates potential issues before they impact users.
That’s where robust Bedrock monitoring comes in; it’s no longer optional but essential for maintaining trust and realizing the full potential of your AI investments. This article serves as a practical guide, diving into the challenges of managing large-scale Bedrock deployments and outlining strategies to automate key aspects of performance tracking and issue resolution.
We’ll explore common pitfalls, demonstrate how to implement automated checks, discuss best practices for cost optimization tied directly to model behavior, and provide actionable insights you can apply immediately to strengthen your AI infrastructure. Get ready to elevate your Bedrock operations from reactive troubleshooting to proactive, data-driven success.
Understanding Bedrock Batch Inference
Let’s dive into Amazon Bedrock’s batch inference capabilities – a powerful tool for handling significant volumes of data. Imagine you need to analyze thousands, or even millions, of customer records to generate personalized recommendations. Doing this one record at a time would be incredibly slow and inefficient. That’s where batch inference comes in. Unlike ‘online’ or ‘real-time’ inference, which processes individual requests immediately (think suggesting the next song on your playlist), batch inference processes data in large groups, allowing you to leverage Bedrock’s models for larger workloads without constantly needing immediate responses.
Think of a financial services company wanting to offer tailored product recommendations based on customer credit data. They have a massive database of customer records and want to determine which products are most likely to be beneficial – perhaps suggesting specific loan options, investment strategies, or insurance plans. Using Bedrock’s batch inference, they can feed all those records into the system at once, allowing a large language model to analyze each record and generate recommendations in parallel. This is far more efficient than processing each customer individually.
The benefits of using batch inference with Amazon Bedrock are substantial. Primarily, it dramatically reduces processing time – what could take days or weeks with traditional methods can be accomplished in hours or even minutes. It’s also cost-effective; by bundling requests together, you often reduce the overall operational costs compared to individual calls. Finally, it allows you to unlock insights from datasets that would otherwise be impractical to analyze due to their sheer size.
Essentially, batch inference lets you harness the power of advanced AI models like those available in Bedrock for large-scale data processing tasks where immediate results aren’t required, opening up possibilities across industries for personalized recommendations, risk assessment, and much more.
What is Batch Inference?

Batch inference refers to processing a large volume of data all at once, rather than individually as requests arrive. Think of it like sending out hundreds of letters through the postal service versus responding to individual emails as they come in. With batch inference, you prepare a dataset – for example, thousands of customer records – and submit them to Amazon Bedrock for processing. The model then generates predictions or outputs for each item in the dataset concurrently.
This contrasts with real-time or online inference, where requests are processed immediately upon arrival. Online inference is ideal for applications requiring instant responses like a chatbot or fraud detection system analyzing a transaction as it happens. Batch inference, however, excels when dealing with large datasets that don’t require immediate results; this makes it well suited for tasks such as generating personalized product recommendations based on historical customer data, scoring loan applicants in bulk, or creating predictive maintenance schedules.
The advantage of batch inference lies in its efficiency. Processing many items simultaneously leverages the computational power more effectively than handling them one by one. This is particularly valuable when you have substantial datasets and want to extract insights without impacting real-time application performance – as demonstrated in our example with the financial services company using Bedrock to generate product recommendations.
The Challenge of Monitoring Batch Jobs
Batch inference jobs, particularly those leveraging powerful services like Amazon Bedrock, are becoming increasingly critical for businesses seeking to extract value from massive datasets. Imagine a financial institution needing to generate personalized product recommendations based on millions of customer records – that’s the scale we’re talking about. However, monitoring these complex workflows is often an afterthought, overshadowed by the initial focus on model development and deployment. This oversight can be incredibly costly, as undetected errors, performance bottlenecks, or runaway costs can silently erode efficiency and impact business outcomes.
The consequences of inadequate bedrock monitoring are far-reaching. A simple coding error in a batch job processing customer data could lead to inaccurate recommendations being pushed out, damaging customer trust and potentially violating regulatory compliance. Performance degradation might mean recommendation generation takes hours instead of minutes, delaying critical decision-making processes. And without proper cost tracking, it’s easy to rack up unexpected charges as Bedrock resources are consumed inefficiently – a particularly painful scenario when dealing with large volumes of data.
Unlike real-time inference where errors surface quickly and visibly, batch jobs often operate behind the scenes, accumulating issues over time before they become apparent. Manual monitoring, relying on periodic checks or ad-hoc investigations, simply isn’t scalable for these high-volume operations. It’s reactive rather than proactive, leaving significant gaps in visibility and slowing down troubleshooting efforts considerably. The sheer volume of data and complexity involved makes it nearly impossible to catch all potential problems with manual processes alone.
Ultimately, a robust bedrock monitoring solution is no longer optional – it’s essential for ensuring the reliability, efficiency, and cost-effectiveness of batch inference workflows. By shifting from reactive manual checks to proactive automated alerts, businesses can quickly identify and address issues, minimize downtime, optimize resource utilization, and maintain the integrity of their AI-powered processes. The ability to gain real-time insights into job execution allows for rapid iteration and continuous improvement, maximizing the return on investment in these powerful technologies.
Why Automated Monitoring Matters

For large-scale batch job processing, especially those leveraging AI services like Amazon Bedrock, manual monitoring quickly becomes unsustainable and unreliable. The sheer volume of data, complex workflows, and distributed nature of these jobs make it virtually impossible for human operators to consistently track every aspect of their execution. Relying on periodic checks or reactive troubleshooting leaves significant gaps in visibility, increasing the risk of undetected errors, performance degradation, and unexpected cost spikes.
Automated monitoring addresses these limitations by providing real-time insights into batch job operations. By integrating tools like Amazon EventBridge, Lambda, and DynamoDB, you can continuously collect metrics related to job status (success/failure), processing time, error rates, resource utilization, and costs. This granular data is then aggregated and presented in a centralized dashboard, offering a comprehensive view of the entire process – something simply not achievable with manual methods.
The benefits extend beyond just visibility. Automated monitoring enables proactive alerts based on predefined thresholds (e.g., exceeding a maximum runtime or error rate). These immediate notifications allow teams to address issues before they escalate into larger problems, significantly reducing troubleshooting time and minimizing potential business impact. Furthermore, automated logging and historical data analysis facilitate root cause identification and optimization of batch job configurations for improved efficiency.
Building an Automated Monitoring Solution
To truly benefit from Amazon Bedrock’s batch inference capabilities, especially when dealing with high volumes of customer records as demonstrated in our example for personalized product recommendations, robust monitoring is essential. This section dives into the technical details of building an automated Bedrock monitoring solution leveraging EventBridge, Lambda, and DynamoDB – a powerful combination that provides real-time visibility into your batch processing operations. The core idea revolves around capturing events generated by Bedrock’s batch jobs and transforming them into actionable insights.
The architecture begins with Amazon EventBridge acting as the central event bus. Whenever a Bedrock batch inference job completes (or encounters an error), it emits events that are routed to a designated EventBridge rule. This eliminates the need for polling or constantly checking job statuses, significantly reducing overhead and ensuring timely alerts. These events contain valuable metadata such as job ID, start time, end time, status code, and any associated logs – information crucial for identifying potential bottlenecks or failures. A simplified architectural diagram would show Bedrock batch inference -> EventBridge Rule -> Lambda Function -> DynamoDB Table.
Next, an AWS Lambda function is triggered by the EventBridge rule. This Lambda acts as a processor, extracting relevant data from the incoming event and transforming it into a standardized format suitable for storage. Beyond simple formatting, this step can include calculations like job duration or error rates. The Lambda also handles any necessary enrichment, such as adding contextual information about the batch job’s purpose or associated datasets. This pre-processing ensures that the monitoring data is clean, consistent, and readily analyzable.
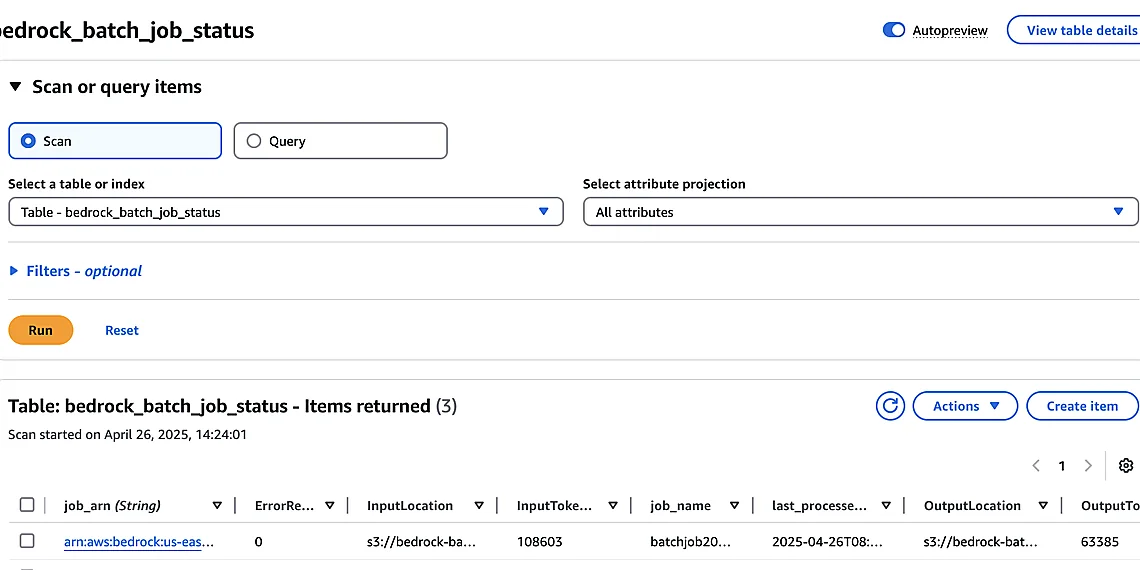
Finally, the processed monitoring data is stored in an Amazon DynamoDB table. DynamoDB’s flexible schema allows for easy adaptation as your Bedrock usage evolves and new metrics become important. The table structure typically includes fields like job ID, timestamp, status code, duration, error message (if any), and potentially other custom dimensions relevant to your business context. This persistent storage enables historical analysis, trend identification, and the creation of dashboards providing a comprehensive view of your Bedrock batch inference performance.
The Architecture: EventBridge, Lambda & DynamoDB
Our automated bedrock monitoring architecture leverages three core AWS services: Amazon EventBridge, Lambda, and DynamoDB. Bedrock batch inference jobs emit events as they progress – completion, failure, etc. – which we configure to be routed by EventBridge. This acts as a central event bus, decoupling the batch job execution from our monitoring pipeline. The key here is that we’re reacting to these events in real-time rather than polling for status updates, providing near instantaneous visibility into job health and performance.
Upon receiving an event from EventBridge, a Lambda function is triggered. This Lambda acts as the processing engine, extracting relevant information from the event payload (e.g., job ID, completion time, error messages). It then transforms this data into a structured format suitable for storage in DynamoDB. The Lambda also performs basic validation and potential enrichment of the data before persisting it – for example, calculating derived metrics like inference latency.
Finally, we utilize DynamoDB as our persistent store for all monitoring data. Each event triggers an update to a record within DynamoDB, effectively creating a time-series dataset representing the lifecycle of each batch job. This allows us to query and visualize historical performance, identify trends, and proactively address potential issues before they impact downstream processes. The schema is designed for efficient querying based on job ID and timestamp.
Practical Considerations & Future Enhancements
Implementing automated Bedrock monitoring requires more than just connecting EventBridge, Lambda, and DynamoDB – it demands careful consideration of practical aspects for ongoing success. Start by focusing on your baseline metrics: inference latency, error rates (both transient and permanent), and throughput. Establish clear thresholds for acceptable performance based on your service level objectives (SLOs). Don’t forget the importance of robust logging within your Lambda function; detailed logs are invaluable when troubleshooting issues. Consider using CloudWatch Synthetics to proactively test your Bedrock batch inference jobs, simulating real-world scenarios and identifying potential problems before they impact users.
Scaling your monitoring solution alongside increasing Bedrock workloads is crucial. For Lambda functions, explore memory allocation optimization – higher memory often translates to increased CPU power, potentially reducing execution time. DynamoDB table design also plays a significant role; consider using DAX (DynamoDB Accelerator) for read-heavy metrics and partitioning strategies that distribute load evenly across shards. Cost optimization should be an ongoing effort; leverage CloudWatch’s cost explorer to identify areas where you can reduce spending without compromising monitoring effectiveness – perhaps adjusting Lambda function timeout values or optimizing DynamoDB storage tiers.
Looking ahead, the potential for enhancements to your Bedrock monitoring system is substantial. Integrating with other AWS services like SageMaker Model Monitor could provide deeper insights into model drift and performance degradation over time. Building custom metrics tailored to specific business needs—such as tracking recommendation acceptance rates or revenue generated per inference—can offer even more actionable intelligence. Furthermore, exploring the use of anomaly detection algorithms within CloudWatch can automate the identification of unusual patterns in your Bedrock batch processing data, allowing for proactive intervention and preventing potential service disruptions.
Finally, remember that a truly effective monitoring solution is an evolving one. Regularly review your thresholds, metrics, and architecture to ensure they continue to meet your changing needs. Consider implementing automated dashboards using services like Amazon QuickSight to visualize key performance indicators (KPIs) and share insights with stakeholders. A feedback loop between the operations team and data scientists involved in model training will also contribute to ongoing improvements in both Bedrock model accuracy and monitoring system effectiveness.
Scaling and Optimization Tips
As your Bedrock batch inference workloads grow, scaling the automated monitoring solution becomes crucial. Initially, DynamoDB’s default provisioned capacity might suffice, but for significantly larger batches (hundreds of thousands or millions of records), consider auto-scaling DynamoDB tables based on consumed read/write capacity units. Lambda functions handling EventBridge events can also be scaled out using concurrency settings and reserved concurrency to prevent throttling during peak periods. Furthermore, implement batching within your Lambda function – processing multiple monitoring metrics in a single database write operation instead of individual writes dramatically reduces DynamoDB costs and improves performance.
Optimizing Lambda function execution is key for cost-effectiveness. Profile your Lambda code using AWS X-Ray to identify bottlenecks; common areas include inefficient data serialization or deserialization, excessive logging, or unnecessary dependencies. Consider using compiled languages like Go or Rust if Python’s performance proves insufficient for complex monitoring logic. Employ connection reuse strategies when interacting with DynamoDB and Bedrock APIs to minimize overhead. Regularly review your Lambda memory allocation – increasing it can sometimes improve execution speed but also increases cost; find the sweet spot through experimentation.
Cost optimization extends beyond just Lambda function and DynamoDB configurations. Leverage EventBridge’s filtering capabilities to reduce unnecessary invocations of your monitoring Lambda functions. Only subscribe relevant events to trigger these functions, avoiding processing irrelevant data. Consider implementing a tiered alerting system based on severity levels; less critical issues can be logged without triggering immediate notifications, reducing operational overhead. Finally, regularly review CloudWatch metrics and cost explorer reports to identify areas for further optimization and potential savings.
The journey through automating Bedrock monitoring has revealed a crucial truth: proactive oversight is no longer optional for reliable batch inference, it’s essential. We’ve demonstrated how to build a robust system that not only flags errors but also provides actionable insights into performance bottlenecks and resource utilization. Embracing this level of automation allows your teams to shift from reactive firefighting to strategic optimization, ultimately maximizing the value you derive from generative AI models deployed through Bedrock. The ability to quickly identify and resolve issues directly translates to improved accuracy, reduced costs, and a significantly enhanced user experience. Remember that consistently high-quality outputs are paramount for building trust in your applications, and automated systems provide the foundation for achieving just that. Implementing these techniques – tracking latency, error rates, cost metrics, and data drift – is a powerful investment with immediate returns. As generative AI continues to evolve, so too must our monitoring strategies; continuous improvement and adaptation will be key to long-term success. Consider this guide as your starting point, a springboard for further experimentation and refinement tailored to your specific workloads. Bedrock monitoring offers a clear path to operational excellence in the age of large language models. To delve deeper into the specifics and explore advanced configurations, we’ve compiled a comprehensive set of resources below; take advantage of these tools to elevate your Bedrock deployments to the next level.
Ready to put what you’ve learned into practice? We encourage you to begin implementing automated monitoring for your Bedrock batch inference pipelines today. The benefits are clear: increased reliability, reduced costs, and faster troubleshooting capabilities. Don’t hesitate to experiment with different metrics and thresholds to fine-tune your system for optimal performance.
Explore the full potential of AWS Bedrock and ensure peak operational efficiency – start building now!
Continue reading on ByteTrending:
Discover more tech insights on ByteTrending ByteTrending.
Discover more from ByteTrending
Subscribe to get the latest posts sent to your email.