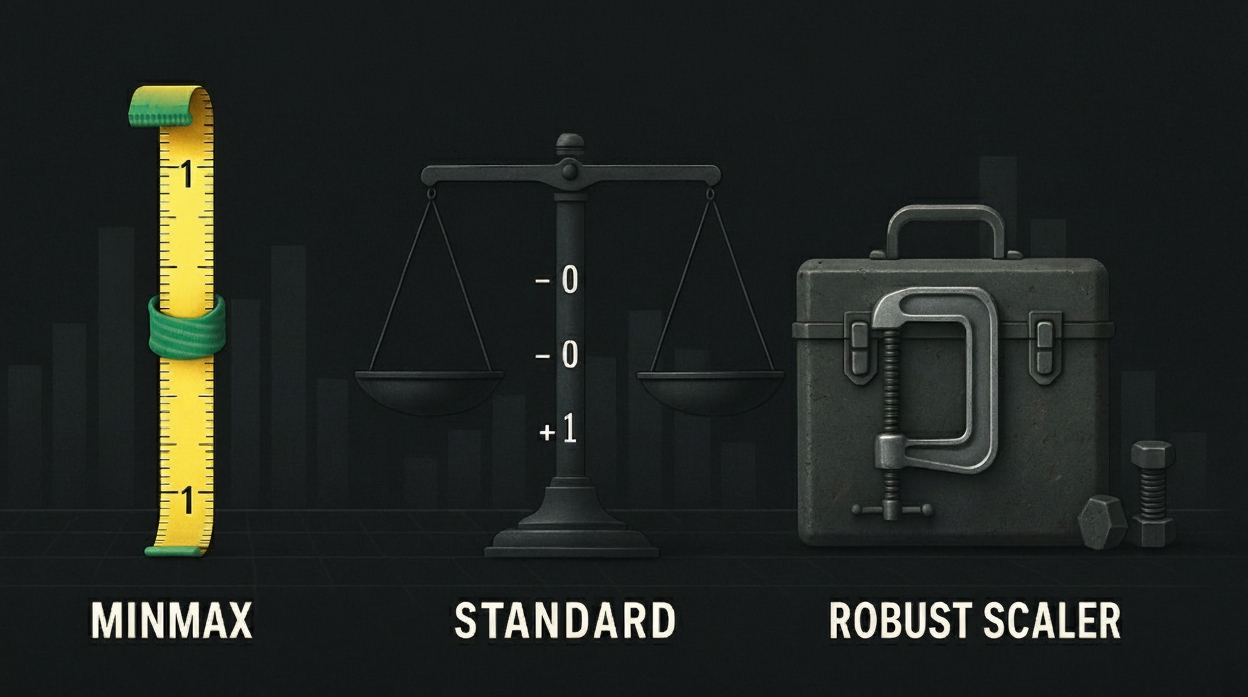



Understanding Data Scaling for Machine Learning
When preparing data for machine learning models, scaling numerical features is often a crucial preprocessing step. Different scalers transform data in various ways, and selecting the right scaler can significantly impact model performance, particularly when dealing with skewed or non-normally distributed datasets. This article breaks down three common scalers – MinMaxScaler, StandardScaler, and RobustScaler – highlighting their strengths and weaknesses.
MinMaxScaler: Simple but Sensitive
The MinMaxScaler scales features by transforming them to a given range, typically between zero and one. It achieves this by subtracting the minimum value of each feature from each data point and then dividing by the range (maximum – minimum). Consequently, it preserves relationships among original data points but is also notably sensitive to outliers.
How MinMaxScaler Works
The formula used for MinMaxScaler transformation is quite straightforward: X_scaled = (X - X_min) / (X_max - X_min). This means each value is rescaled relative to the minimum and maximum observed values of a feature.
- Advantages: Easy to understand and implement, preserves relationships between original data points.
- Disadvantages: Highly sensitive to outliers; a single outlier can drastically shift the scaled values of other data points. It’s generally not suitable for datasets with significant skewness or non-normal distributions without prior transformation.
For example, imagine predicting house prices where one property is a mansion significantly exceeding all others in value. MinMaxScaler would compress the majority of houses into a narrow range, potentially losing valuable information.
StandardScaler: Centering and Normalizing
The StandardScaler standardizes features by removing the mean and scaling to unit variance. This process effectively centers each feature around zero and gives it a standard deviation of one. As a result, data becomes less sensitive to different units or scales, which is beneficial for algorithms that assume normally distributed data.
Understanding Standardization
The formula for StandardScaler is X_scaled = (X - μ) / σ, where μ represents the mean and σ denotes the standard deviation of the feature. However, like MinMaxScaler, StandardScaler remains affected by outliers as they influence the calculation of both the mean and standard deviation.
- Advantages: Makes data less sensitive to different units or scales. Often works well with algorithms that assume normally distributed data.
- Disadvantages: Still affected by outliers, as they influence the calculation of the mean and standard deviation. Less effective when features have significantly different variances.
For instance, if analyzing customer spending habits where one feature is income (in dollars) and another is age (in years), StandardScaler helps bring them to a more comparable scale.
RobustScaler: Outlier Resistance for Improved Scaler Performance
The RobustScaler addresses the outlier problem by employing robust statistics, specifically the median and interquartile range (IQR). By scaling features using these measures, it minimizes susceptibility to extreme values. Therefore, this scaler is particularly well-suited for datasets with skewed distributions or known outliers.
How RobustScaler Works
The formula used by RobustScaler is X_scaled = (X - Q1) / (Q3 - Q1), where Q1 represents the first quartile (25th percentile) and Q3 denotes the third quartile (75th percentile). This approach makes it significantly more robust to outliers compared to both MinMaxScaler and StandardScaler.
- Advantages: Significantly more robust to outliers compared to MinMaxScaler and StandardScaler. Suitable for datasets with skewed distributions or known outliers.
- Disadvantages: May not be as effective if outliers are truly representative of the underlying data distribution; it can also mask important information contained within outliers in some cases.
For example, consider a dataset containing income levels where a few individuals earn exceptionally high salaries; RobustScaler will provide a more stable scaling compared to StandardScaler or MinMaxScaler.
Comparison Table
| Scaler | Outlier Sensitivity | Distribution Assumptions | Typical Use Cases |
|---|---|---|---|
| MinMaxScaler | High | None | Data with a limited range and no outliers. |
| StandardScaler | Moderate | Normal Distribution | Algorithms that assume normally distributed data. |
| RobustScaler | Low | None | Datasets with outliers or skewed distributions. |
Choosing the Right Scaler
Selecting the optimal scaler hinges on your data’s characteristics and the specific machine learning algorithm you’re employing. If you suspect outliers, RobustScaler is often a good starting point. Conversely, if your data is approximately normally distributed and lacks significant outliers, StandardScaler might be sufficient. Should you need to constrain values within a defined range and are confident in the absence of outliers, MinMaxScaler can prove useful.
Ultimately, experimentation and evaluation using appropriate metrics on your validation set remain key steps in determining which scaler yields the best results for your specific machine learning task. Understanding each scaler’s properties will help you make informed decisions about data preprocessing.
Source: Read the original article here.
Discover more tech insights on ByteTrending.
Discover more from ByteTrending
Subscribe to get the latest posts sent to your email.